Warlock's Gambit trace analysis
2022-09-01
I did some analysis on the traces of warlock’s gambit.
I captured traces both using Chromium’s dev tools and bevy’s trace_chrome features. I usually use the trace_tracy feature, and run tracy, but this time, for the benefit of a potential employer (and my curiosity), I decided to try out the chrome version.
Sadly, the trace as captured by chrome in the WASM stack do not help much.
The rust symbols show up, but bevy relies heavily on type erasure both for performance and ergonomics.
Specifically the game systems are added to a scheduler as an erased function, and ran each frame. Using the argument types of the function, the scheduler knows which systems touches which components, and only runs in parallel systems that do not touch mutably the same components. This allows automatic concurrency, but at the cost of decoupling the running of game systems from their declaration, thus losing a lot of “free” debugging tools.
However, bevy smartly sets up custom tracing events, actually associating the system ran with the name of the function of the system. Bevy uses the tracing-wasm crate for tracing on wasm, sadly, I didn’t manage to get it working. It seems chrome has difficulties properly understanding the trace event hierarchy.
Follows the tracing files for native and chrome telemetry:
Both traces are in the chrome tracing format, so they work in the same tools.
I’ve been recommended to use https://ui.perfetto.dev/ to inspect chrome traces, but I fond in the chromium dev website https://speedscope.app and I find it much better. The sandwich view makes understanding what takes most time a piece of cake (or sandwich as the name would have it).
speedscope has three views accessible through the top left bar:
- Time order (the classical trace view)
- Left heavy (shows to the left the longest spans)
- Sandwich (show as list, allowing you to order by “self” time or total run time)
“self” time is the time a span ran minus inner span runtime.
fn fun1() {
    takes_a_lot_of_time();
    span2();
    span3();
}
fn fun2() {
    span2();
    span3();
}
Here, fun2 does no work beside calling other functions with spans, meaning its self time is very low. While fun1 will have a long self time. Self time tells you which function to optimize.
I recommend you get familiar with the sandwich view, because it is the fastest way to figure out what is slowing down your app.
Following is the “left heavy” view in speedscope.app for warlock’s traces. Click on the heading to download the file.
native traces

chrome traces
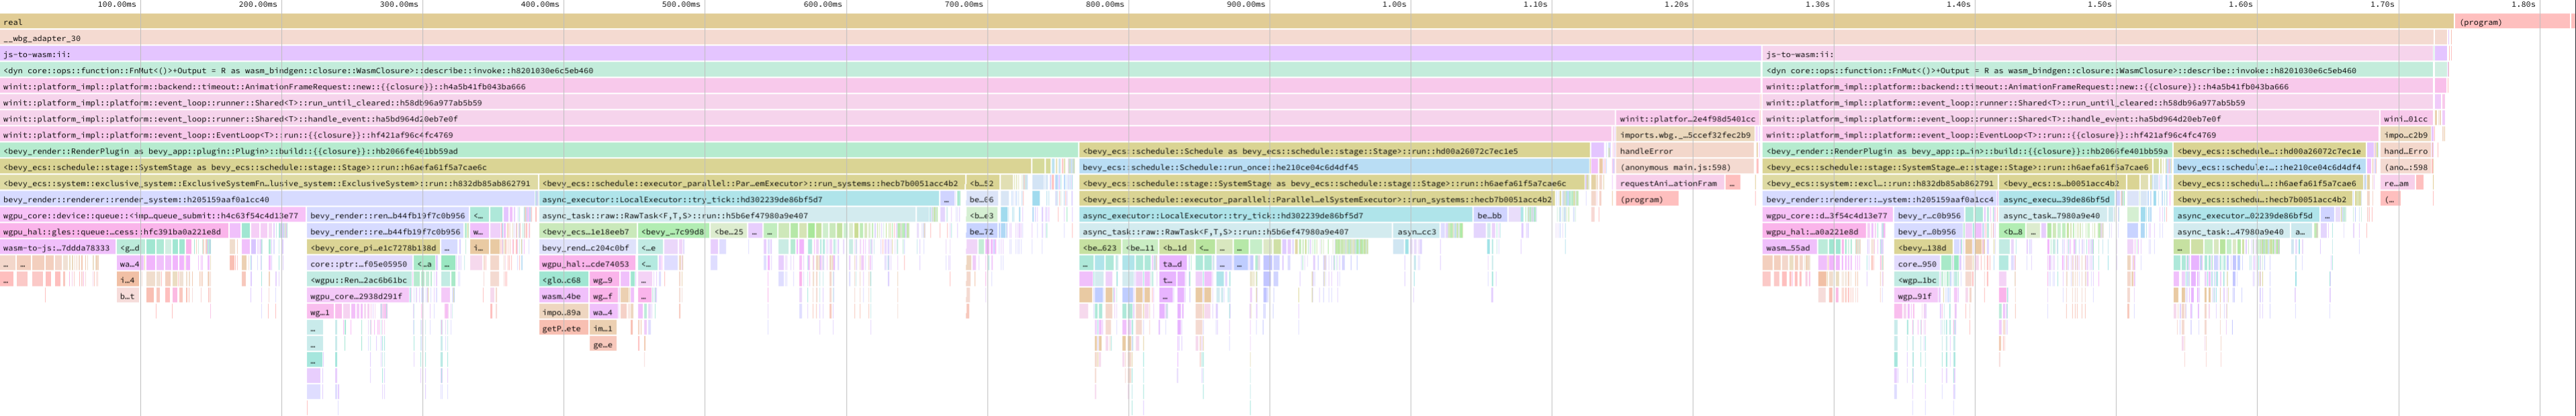
Analysis
The native trace will take about 5 minutes to open on https://speedscope.app, but here is what I can get out of it:
Notice that 30% of runtime is
prepare_systemsself time! It’s the method responsible for reading systems access types and scheduling them according to their declared dependency and mutual exclusivity (exclusive writes etc.) That time is completely unreasonable, and planned for removal with the new scheduler rewrite.But this doesn’t concern wasm at all! Since wasm is single-threaded,
prepare_systemsis simply skipped, since everything is sequential anyway. This implies that the WASM version is potentially faster than the native versionFurthermore, I’m personally offended how bevy handles scheduling. The system list is static since the first frame, yet, the dependency calculation is ran every frame. In addition, the graph building code is very inelegant, and naturally O(n²),
nbeing the system count. This is especially damning in the render extract stage where about a hundred systems are scheduled.The second most expensive code seems to be rendering. Inspecting the chrome trace, it seems most time is spent queuing GPU commands. It is probably that bevy could minimize that, given that we have at most 30 sprites on screen here.
The third most expensive function finally seems to be the lighting extraction method. There is no lights and all materials are unlit, I’m really not sure what bevy is doing there.
The systems warlock’s gambit has control over are difficult to catch, especially since the names are mangled, even using bevy’s tracing feature, due to usage of states, which are also due to be replaced. You can find some in the
CoreStage::Updatespan.One of our dependencies, used to select cards with ray casting, is visible in
CoreStage::First, but you can see that compared to bevy’s overhead, its impact is minimal
With this insight, I’ll probably be able to help optimize bevy a little bit. I won’t touch the scheduling, since it is currently being rewritten. But it seems some low hanging fruits are:
check_visibilityprepare_lightsprepare_windows